
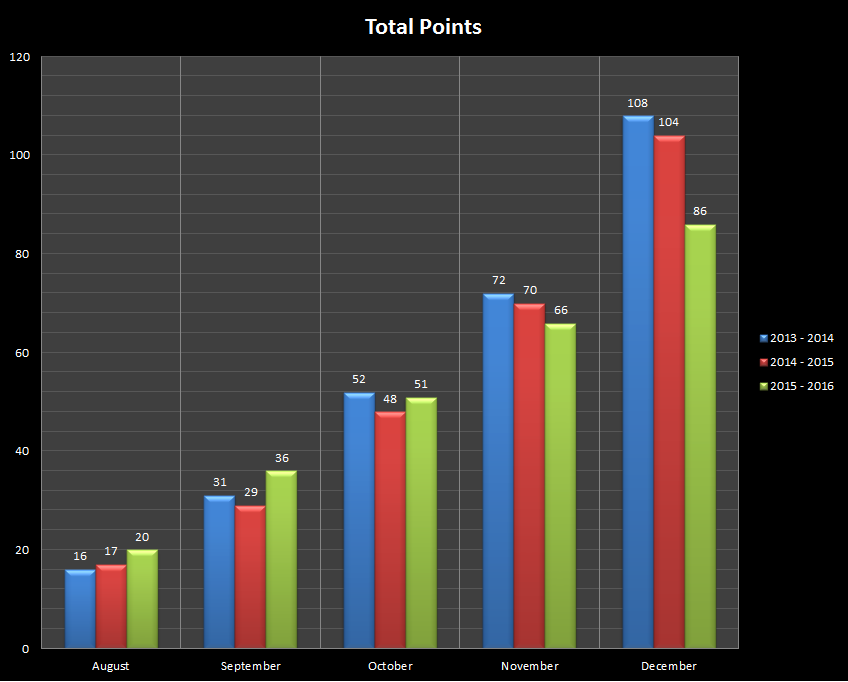
As there is only Cup action this weekend, and due to the unpredictable nature of the games this season i thought i might put together a little comparison. The charts below show the previous two seasons compared to this year.
Things started off well this year, but from October onwards scoring has been low. Part of this has been down to the number of games played, in August this year there were 40 games/points available compared to 27 (13/14) and 30 (14/15).
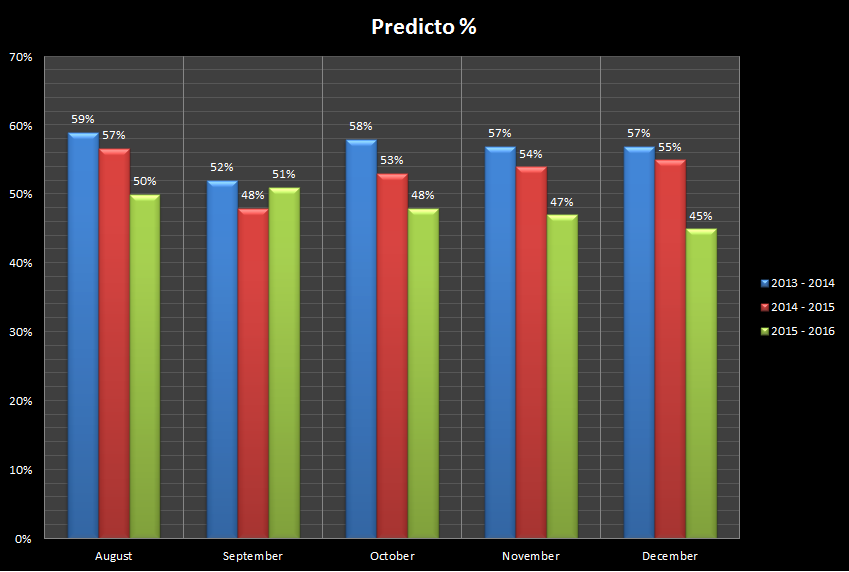
Graph showing the % of correct predictions. This has only been over 50% once, compared to the previous two years where it was only under 50% in two years.
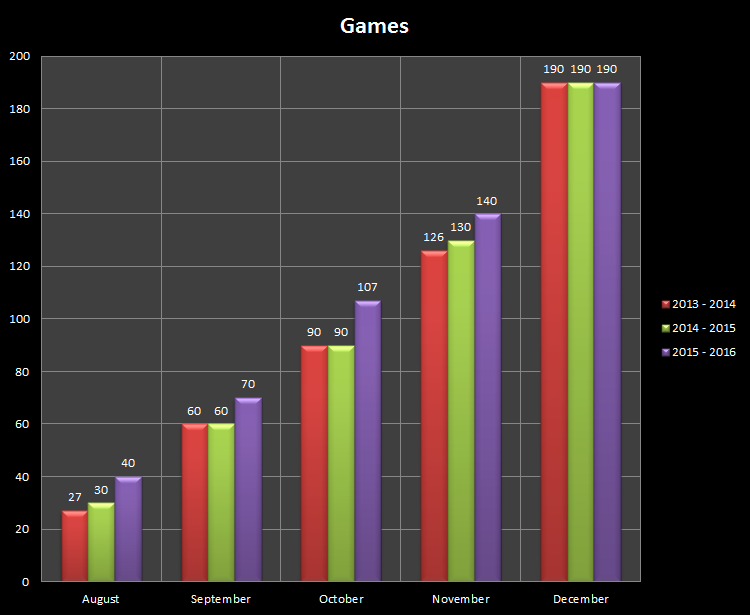
Final graph to confirm number of games
If those stats didn't float your boat, here is a recap of some of the bonus videos so far this year
No comments:
Post a Comment
have your say here